1. Introduction
Plant growth is fundamentally different from animal growth: it is localized in zones of undifferentiated cells called meristems, and it is continuous throughout the plant's life. This localized and continuous growth is the origin of the spiral shapes observed in stems, leaves and inflorescences.
2. Types of Meristems
- Shoot apical meristem (SAM): at stem tip, produces leaves and flowers
- Root apical meristem (RAM): at root tips, protected by the root cap
- Intercalary meristem: at the base of grass internodes
- Vascular cambium: lateral meristem producing wood and phloem
3. Spiral Growth
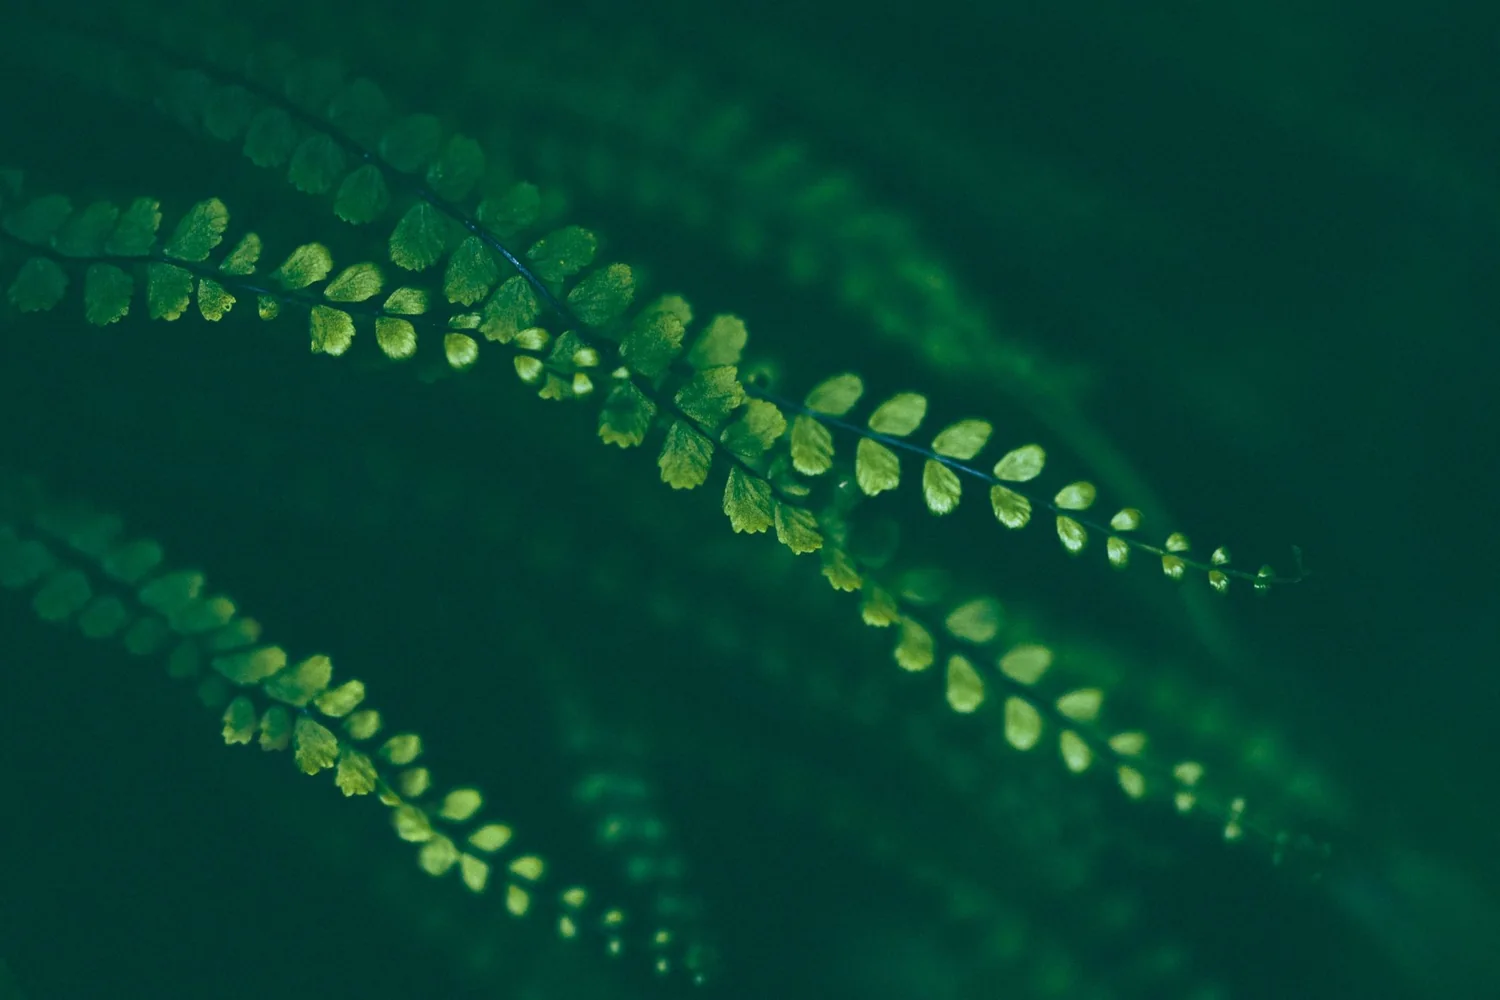
The tendril of a climbing plant is an example of active helical growth. It is produced by differential growth: one side of the tendril grows faster than the other, generating curvature. When the tendril touches a support, it winds around it forming a helix. The direction of winding (right or left) is often genetically determined.
4. Role of Auxin
Auxin (indole-3-acetic acid, IAA) is the main plant growth hormone. It is produced in the apical meristem and distributed downward by active polar transport. Asymmetric auxin distribution causes differential growth: the side with more auxin grows faster, bending the stem. This is the mechanism of phototropism (bending toward light) and gravitropism (bending downward).
5. Conclusion
The spiral growth of plants is a direct consequence of the meristematic localization of growth and the hormonal gradients that regulate it. It is not a mysterious property but the predictable result of well-characterized biochemical and biophysical mechanisms.
The relation to the site’s thesis is precise: plant growth driven by a meristem and local flows may share geometry, dynamics, or representation with another family of phenomena, but these levels are not identical. Comparison becomes scientific when it names the proposed shared mechanism, the variables that differ, and the test that could distinguish them.
The relation to the site’s thesis is precise: plant growth driven by a meristem and local flows may share geometry, dynamics, or representation with another family of phenomena, but these levels are not identical. Comparison becomes scientific when it names the proposed shared mechanism, the variables that differ, and the test that could distinguish them.
The relation to the site’s thesis is precise: plant growth driven by a meristem and local flows may share geometry, dynamics, or representation with another family of phenomena, but these levels are not identical. Comparison becomes scientific when it names the proposed shared mechanism, the variables that differ, and the test that could distinguish them.
Approaching the phenomenon without confusing image and mechanism
The concrete starting point is plant growth driven by a meristem and local flows. The apical meristem produces new organs where cells divide and differentiate. A visible spiral can result from initiation order, growth, and neighborhoods, not from a pre-drawn template. The system is local, dynamic, and history-dependent. This first distinction matters because a winding form can be a trajectory, a structure, a projection, or simply a graphical convention.
The model that makes comparison testable
Auxin and its polar transporters can create local maxima favoring primordium initiation. An existing organ then changes the transport field and the probability of a new initiation. The pattern therefore results from feedback, not one isolated constant. [1] The model is not the object: it is a description whose assumptions must remain visible.
An example, then its counter-example
Two plants can show different parastichy families depending on stage, size, and growth constraints. Visible counts describe neighborhoods in the mature organ; they do not directly give cell number or the complete genetic plan. The counter-example is as instructive as the example: it shows which variable is missing when moving from one domain to another.
What can actually be measured
A study follows primordia through time and measures divergence angle, plastochron, and transporter position. Local perturbations then test causality. A final photograph is useful for geometry but insufficient to reconstruct development. A quantitative figure must distinguish published data, theoretical calculation, simulation, and conceptual diagram.
Decomposing variables instead of following the silhouette
To understand plant growth driven by a meristem and local flows, separate at least the variable that rotates, the one that changes scale, and the one that transports information or matter. The apical meristem produces new organs where cells divide and differentiate. A visible spiral can result from initiation order, growth, and neighborhoods, not from a pre-drawn template. The system is local, dynamic, and history-dependent. A global form can remain stable while its components are replaced; conversely, a trajectory can change shape without a new local mechanism.
The counter-example that protects the reasoning
The plant spiral is therefore a geometric reading of a growth sequence. It supports the site’s thesis through convergence between cellular dynamics and visible form while preserving a clear boundary among mathematical model, hormonal mechanism, and final pattern. We therefore cannot conclude from an image alone. We must ask which observation would falsify the hypothesis, then keep negative results in the comparison. This discipline is especially important when several models produce a similar outline.
A reproducible method
A study follows primordia through time and measures divergence angle, plastochron, and transporter position. Local perturbations then test causality. A final photograph is useful for geometry but insufficient to reconstruct development. To make the result checkable, preserve parameters, units, resolution, initial conditions, and calculation method. An interactive visualization should also provide a readable initial state and a reset control; otherwise readers see an output without understanding its dependencies.
Open questions
The model explains auxin and its polar transporters can create local maxima favoring primordium initiation. an existing organ then changes the transport field and the probability of a new initiation. the pattern therefore results from feedback, not one isolated constant. [1] but does not answer questions at every scale. We still need to determine how initial conditions, perturbations, and system boundaries alter the pattern. This is where research begins: not by adding an analogy, but by formulating a prediction that could be measured.
Limits and scope of the analogy
The plant spiral is therefore a geometric reading of a growth sequence. It supports the site’s thesis through convergence between cellular dynamics and visible form while preserving a clear boundary among mathematical model, hormonal mechanism, and final pattern. [2]
Where the spiral is — and where it is not
The relation to the site’s thesis is precise: plant growth driven by a meristem and local flows may share geometry, dynamics, or representation with another family of phenomena, but these levels are not identical. Comparison becomes scientific when it names the proposed shared mechanism, the variables that differ, and the test that could distinguish them.
References
- [1]Turing, Alan M.. (1952). The Chemical Basis of Morphogenesis. Philosophical Transactions of the Royal Society B. DOI: 10.1098/rstb.1952.0012
- [2]Vogel, Helmut. (1979). A Better Way to Construct the Sunflower Head. Mathematical Biosciences. DOI: 10.1016/0025-5564(79)90080-4