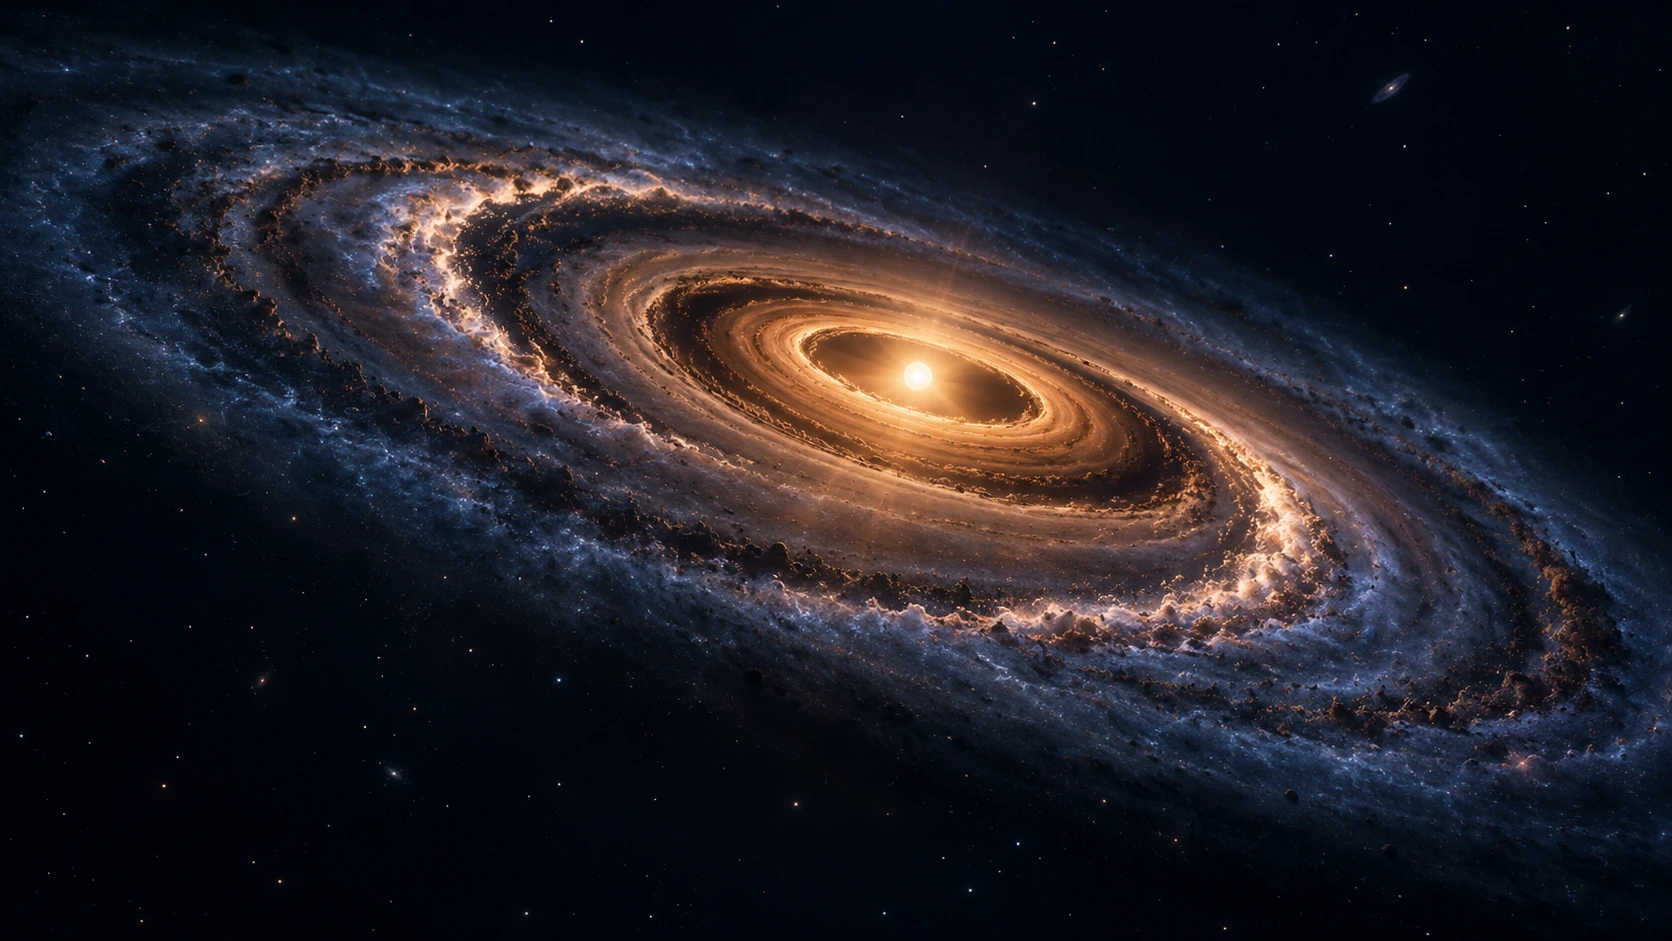
Analysis and methods dossier. The cover is an artistic view, not an astronomical observation. Plots show idealized relations and are not fitted to MWC 758 data.
1. Seeing an arm, inferring a cause
A bright spiral in a dusty disk immediately suggests a planet drawing it. That hypothesis is physically plausible, but an image alone does not settle the problem. We see projected intensity filtered by an instrument, not a complete map of mass and forces. This dossier follows the chain from visible structure to an inference about a hidden object, asking at each step what is measured, what is modeled and what else might create a similar appearance.
The survey presented by ESO in 2024 illustrates the diversity of SPHERE disk observations: rings, cavities, asymmetries and spirals do not collapse into one universal shape. That diversity motivates testing mechanisms rather than automatically associating a pattern with a particular planet. [1]
2. Measure pitch without imposing a golden ratio
For a logarithmic spiral, pitch i is the angle between the arm’s tangent and the local azimuthal direction. For a small displacement, radial and azimuthal components are dr and r dφ, giving tan i. Parameter b can take many values; there is no requirement for a golden spiral. In a real disk, pitch may vary with radius and one b may describe only a segment. A local fit can be more honest than forcing one elegant curve across the entire image.
For b = 0.18 the calculation gives about 10.2°; for b = 0.30, about 16.7°. These are diagram examples, not astronomical measurements. A real estimate requires defining an arm ridge, estimating its width and propagating uncertainty in disk center. A small center displacement changes both r and φ, especially at small radii. An error in starting geometry can therefore imitate a physical change in the arm.
3. A pattern is not a queue of grains
When stellar gravity dominates, inner regions rotate faster than outer ones. A material line painted into the gas is therefore stretched by shear. A density wave is not that material line: particles can cross a compressed region while the pattern advances at a different angular speed. Traffic passing through a moving congestion region offers a limited analogy, but cannot replace the equations. Pressure, forces and angular-momentum transport remain specific to the disk.
At corotation, Ω = Ωₚ. On opposite sides, gas overtakes the pattern or is overtaken by it. This affects perturbation propagation and winding. Apparent motion between epochs can therefore add information unavailable in one image. Yet the same structure must be compared with reliable registration and known processing. Changing illumination can shift a bright ridge without moving the same material. Pattern speed requires its own inference assumptions.
4. From a small perturbation to a shock
Cimerman and Rafikov compared nonlinear planet-driven wave theory with hydrodynamical simulations. Their study illustrates quantitative testing of approximations, including propagation and damping, rather than validating theory solely through resemblance to an image. [2]
A weak disturbance need not remain weak as it travels. Compression can alter local propagation, steepen the profile and produce a shock. Shocks convert mechanical energy and transport angular momentum. Rafikov studies the heating and disk evolution associated with spiral density waves becoming shocks, distinguishing a visible arm from one dynamically reshaping the disk. [3]
5. Another cause: the disk’s own gravity
For a thin gaseous disk, Q compares pressure and rotational support with self-gravity. In the ideal local axisymmetric problem, Q below one signals instability. That is not a general verdict on every spiral: thickness, cooling, global geometry and nonaxisymmetric modes change the question. Kratter and Lodato review gravitational instabilities as disk-evolution mechanisms and discuss when they matter. [4]
Our Q curves are toy profiles chosen to cross or avoid the threshold; they imply no measured disk mass. They expose an inverse-problem difficulty: Σ sits in the denominator but is often difficult to infer from light. Uncertain opacity or temperature can bias Σ and therefore Q. A dynamical conclusion inherits radiative assumptions; errors propagate through the argument rather than remaining in separate compartments.
6. Bright does not always mean massive
This expression assumes an isothermal layer without scattering or background illumination. At small optical depth, Iν ≈ Bν(T)τ, so greater column can increase intensity. At large optical depth, Iν approaches Bν(T), making additional material hard to see. Saturation therefore loses column information. A hotter region may also brighten without gaining mass. Bν is proportional to T only in the Rayleigh–Jeans regime, which must be checked for the chosen frequency and temperature.
Scattered starlight primarily probes an illuminated surface. Millimeter continuum depends on emitting grains, their properties and temperature. Molecular lines add gas and kinematic information with assumptions about abundance and excitation. A spiral present in one channel and absent in another is not automatically contradictory: channels probe different regions and quantities. Combining them becomes powerful when a model must explain their differences, not merely the general presence of an arm.
7. Correct projection without manufacturing a shape
An inclined thin circle appears as an ellipse with b/a = cos i. In that model, deprojection divides the minor-axis coordinate by cos i. Near edge-on viewing, this greatly amplifies uncertainty. A scattering surface at finite height also differs from the gas midplane. Treating the whole image as an infinitely thin disk may create artificial arm offsets. Geometric assumptions belong to the physical model, not merely cosmetic image correction.
A serious analysis would retain multiple data-compatible geometries rather than publishing one deprojected image without uncertainty. For each, it would estimate ridges, pitch and inter-channel offsets. If a planet inference disappears under small plausible changes in inclination or scattering height, its strength must be reconsidered. This does not diminish the image; it identifies the information it actually contains. Evidence improves when its failure conditions are explicit.
8. MWC 758: a detection and its limits
Wagner and colleagues reported infrared observations and a spectrum in 2023 interpreted as protoplanet MWC 758c, consistent with a role in driving the arms. Their analysis considers different temperature and extinction possibilities. That interpretation belongs to their study; this dossier’s artistic cover is not an independent detection. [5]
F = Fint exp(−τ) shows a simple degeneracy: a bright but attenuated object may resemble a fainter, less obscured object in one band. Our plot varies only intrinsic flux and attenuation; it does not convert curves into planetary masses. That would require atmospheric models, age, thermal history and filter responses. Multiple bands and spectral shape can reduce the degeneracy without necessarily eliminating it.
The 2024 JWST/NIRCam study by Wagner and colleagues detects the spiral disk but no clear companion in its probed regions. Its sensitivity at the separations of previously reported candidates is insufficient to test them adequately. No new detection therefore does not equal refutation of the candidate: separation and contrast coverage determine what the result can exclude. [6]
9. A chain of evidence rather than a convincing portrait
Forward modeling starts from physical parameters, computes gas and dust, then radiation and finally the instrument’s expected signal. Inference compares this prediction with data and explores compatible parameters. Models must undergo the same processing as observations: angular resolution, central mask, stellar subtraction and correlated noise. Otherwise a processing residual may be mistaken for physics. A planet model’s proper competitor is another explicit model, not an uncalculated mental picture.
Stronger inference can combine arm geometry, pattern speed, gas kinematics, source spectra and temporal consistency. These clues are not always independent: shared assumptions about temperature or geometry can correlate errors. Accumulating plots cannot replace dependence analysis. Ideally a new measurement genuinely risks falsifying the model through a prediction fixed before acquisition. That moves research beyond visual confirmation.
10. What spirals actually teach us
Arms can inform us about transport, heating, disk dynamics and possible perturbers. Their explanatory power comes from connecting these questions, not from assuming one shape has one cause. The most useful result may be a limit: masses excluded under specified assumptions, a dominant uncertainty identified or a two-epoch experiment separating scenarios. Such negative knowledge is scientific substance even when it does not immediately deliver a portrait of a new planet.
11. Worked calculation: what a nondetection excludes
Let θ represent planetary-scenario parameters and C(θ) the probability of detecting a companion with those parameters. In an elementary model without false positives, nondetection probability is 1 − C(θ). If C is near zero, seeing nothing barely penalizes the scenario; if C is near one, absence strongly constrains it. Sensitivity curves must therefore be read with spatial coverage. An instrument’s name alone does not imply uniform sensitivity at every radius.
Bayes’ formula does not replace instrument analysis; it identifies required ingredients: calibrated detection probability and explicit prior assumptions. Injecting and recovering artificial companions through the same processing can help estimate completeness. Temperature, extinction and age affect conversion from flux limits to mass limits. Ignoring these conditions turns conditional constraints into absolute exclusions the experiment never supplied.
12. Choose the next observation to learn more
Two scenarios may reproduce an initial image yet predict different pattern speeds, spectra or gas signatures. The next useful measurement targets their disagreement rather than necessarily adding another image in the same band. Predicted separation can be compared with expected noise before observing. If it remains below registration uncertainty, another identical epoch may teach little. A different line or spectral range may discriminate better. Scientific efficiency lies in separating explanations, not accumulating images.
References
- [1]European Southern Observatory. (2024). Groundbreaking survey reveals secrets of planet birth around dozens of stars. ESO — présentation institutionnelle du relevé SPHERE. https://www.eso.org/public/news/eso2405/
- [2]Nicolas P. Cimerman; Roman R. Rafikov. (2021). Planet-driven density waves in protoplanetary discs: numerical verification of nonlinear evolution theory. Manuscrit de recherche, arXiv:2108.01423. https://arxiv.org/abs/2108.01423
- [3]Roman R. Rafikov. (2016). Protoplanetary Disk Heating and Evolution Driven by the Spiral Density Waves. Manuscrit de recherche, arXiv:1601.03009. https://arxiv.org/abs/1601.03009
- [4]Kaitlin Kratter; Giuseppe Lodato. (2016). Gravitational Instabilities in Circumstellar Disks. Annual Review of Astronomy and Astrophysics. DOI: 10.1146/annurev-astro-081915-023307. https://doi.org/10.1146/annurev-astro-081915-023307
- [5]Kevin Wagner et al.. (2023). Direct images and spectroscopy of a giant protoplanet driving spiral arms in MWC 758. Manuscrit de recherche, arXiv:2307.04021. https://arxiv.org/abs/2307.04021
- [6]Kevin Wagner et al.. (2024). JWST/NIRCam Imaging of Young Stellar Objects. I. Constraints on Planets Exterior to The Spiral Disk Around MWC 758. Manuscrit accepté pour The Astronomical Journal ; arXiv:2401.02830. https://arxiv.org/abs/2401.02830