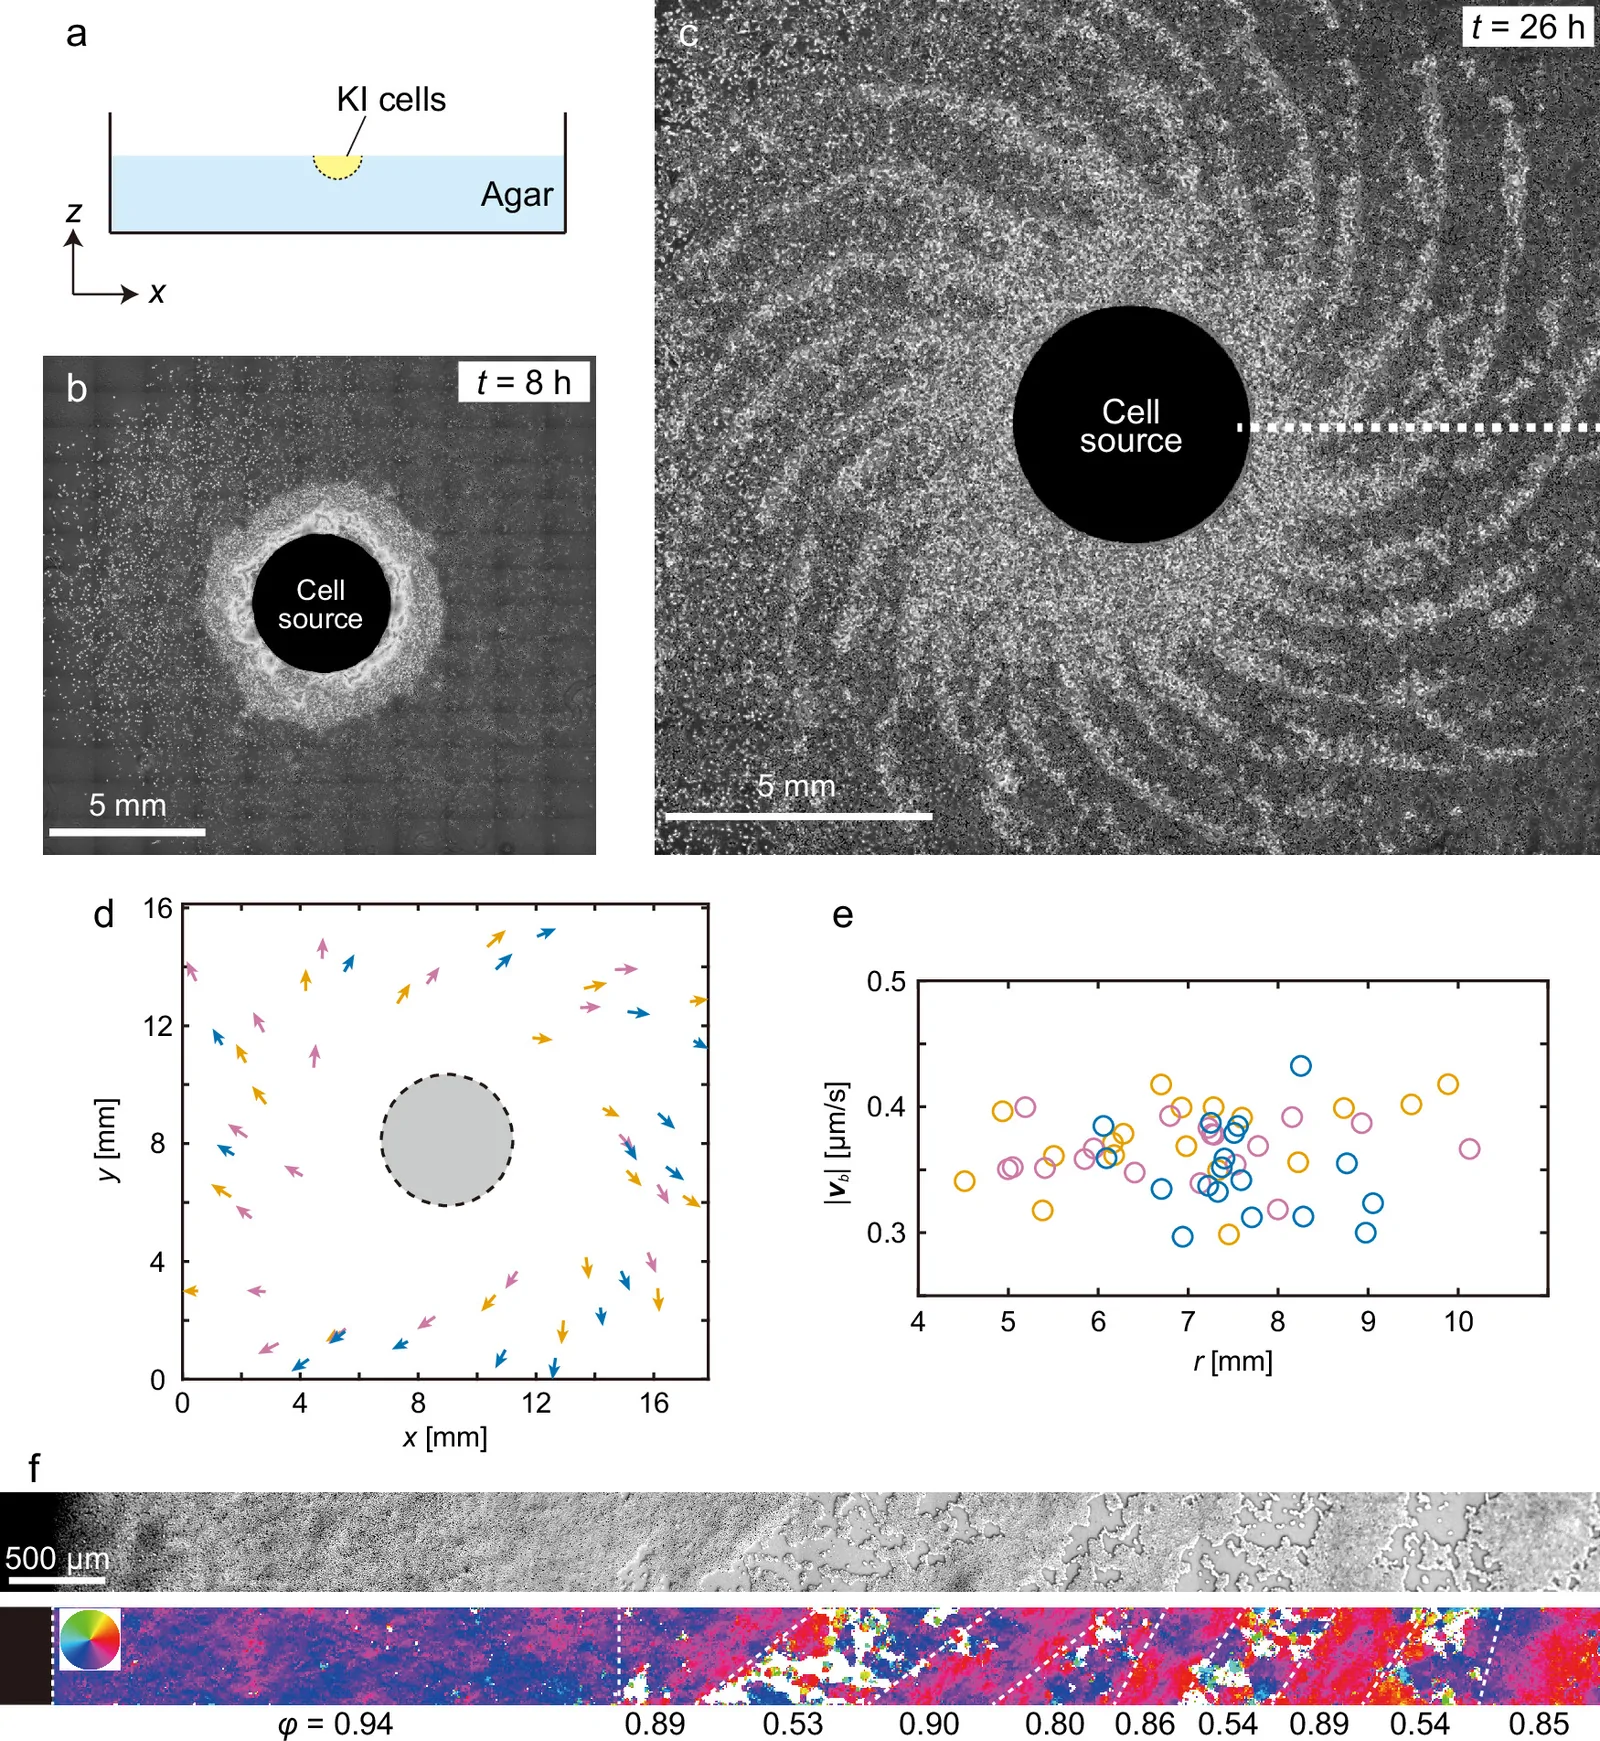
Published 29 October 2026 from a study released 26 October. The cover is an experimental figure from the original paper, reused under CC BY 4.0; vector diagrams are explanatory constructions, not new data.
1. How a microscopic bias crosses scales
A collective spiral can emerge from an almost imperceptible asymmetry in each cell’s motion. The striking result is not merely that a group rotates: a weak directional preference, neighbor alignment and a continuous cell supply organize fronts that travel outward while turning. The aggregate reaches centimetre scale although its directional ingredient begins at cellular scale. [1]
2. The organism and experimental protocol
The authors study Dictyostelium discoideum, a social amoeba whose isolated cells aggregate as food runs out. To separate collective transport from ordinary chemotaxis, they use chemotaxis-deficient KI mutants. Starved cells are placed in a circular dimple of 2 mm radius on non-nutrient agar. The deposit acts as a localized source that keeps feeding cells into the front. This setup constrains initial geometry; it is neither an intact organism nor animal tissue. [1]
The KI cells answer a specific question: can a population acquire a collective rotation even when ordinary chemical attraction does not guide its aggregation? The mutation removes one important explanation, but it does not make the cells passive. They move, adhere, collide and can align. The experiment asks how these active interactions, combined with a migration asymmetry, organize a front. It does not imply that chemotaxis is absent from all Dictyostelium biology.
The setup is open: cells gradually leave the deposit and feed the surrounding space. A closed model conserves its cell number and cannot test the role of incoming flux in the same way. This distinction matters when comparing systems supplied with material, but comparison with developing tissue remains conceptual. An agar-plate assay is not a miniature embryo. [1]
3. A measured timeline, not an instantaneous spiral
The first dense annulus appears after about eight hours. By 26 hours the front has become a clockwise, multi-arm structure. The authors report three independent repetitions. These times belong to this specific protocol; they are not universal constants for Dictyostelium. Figure 1 of the paper shows the setup, annulus and observed pattern; original figures are credited and licensed. [1]
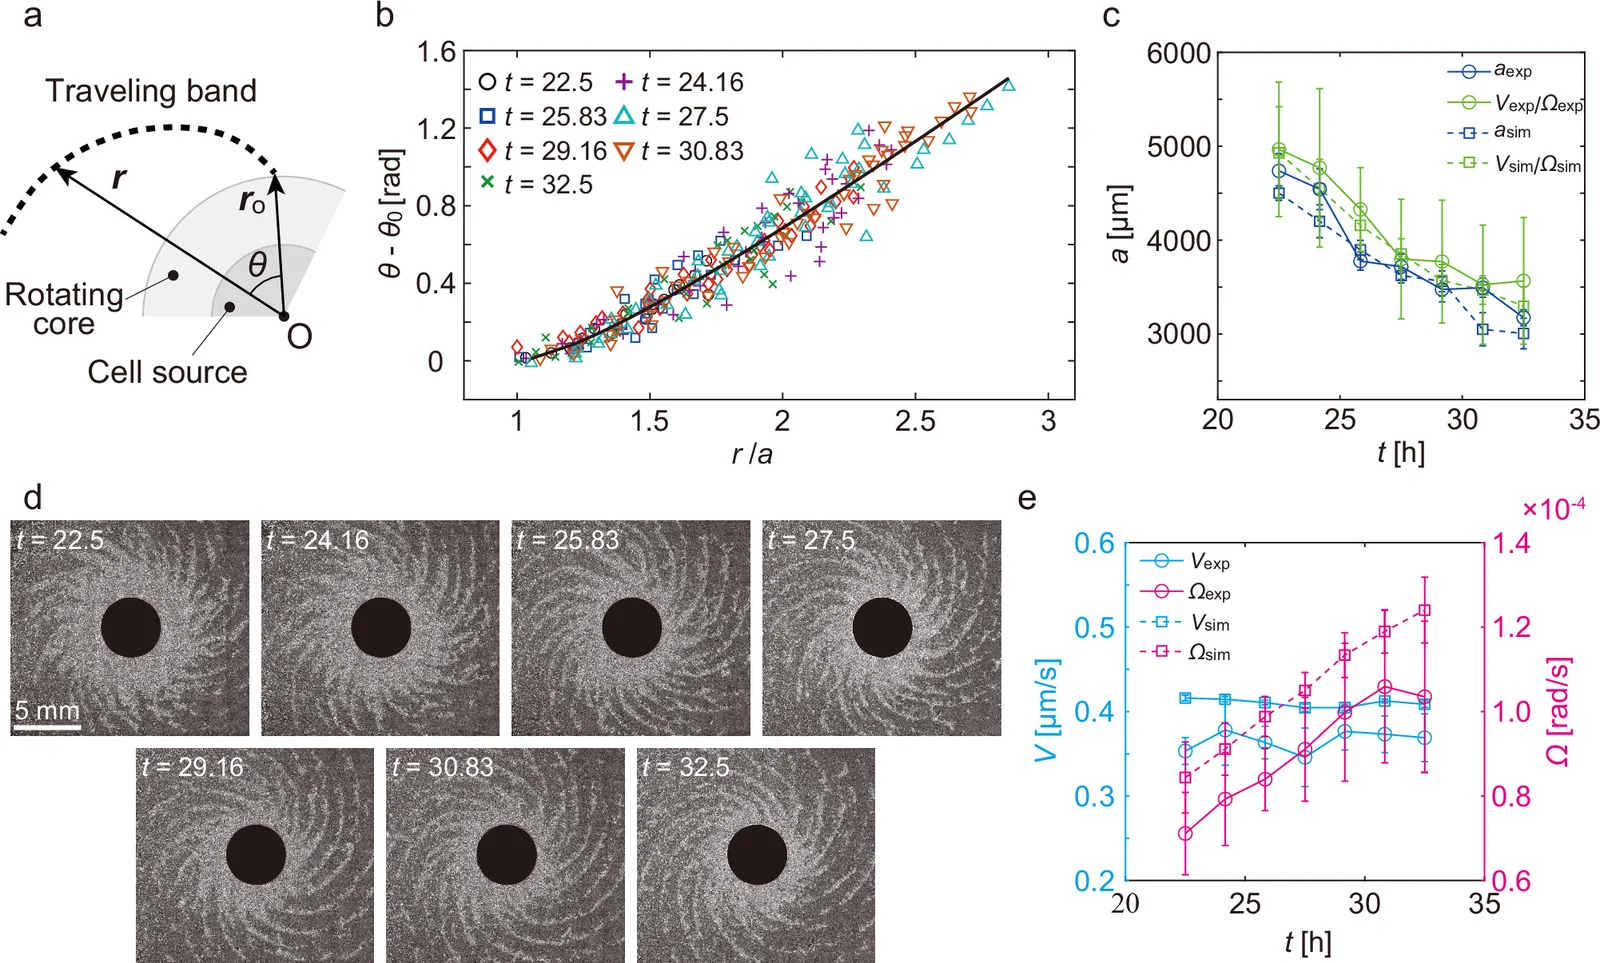
The geometry of the arms offers a second level of analysis. The authors fit the front with a circle involute and compare measurements with velocity parameters. This is not simply a spiral drawn over a photograph: positions along the front, their angles and time evolution are measured. Figure 2 brings together this fit, the changing arms and experimental speeds. [1]
The experimental figure is more than a silhouette. The authors measure each band’s displacement perpendicular to its front and compare that speed with distance from the center. This separates radial propagation from rotation: a band can move outward while the core also sweeps it sideways. Normal speed stays nearly uniform across measured positions, with a reported mean of 0.363 μm/s. This supports the speed V used in the geometric law; it does not mean every cell moves at exactly that speed. [1]
Figure 2 tests more than visual resemblance. The authors plot arm angle against distance from the center, then test the involute after scaling by a. They compare two estimates of a: fitting the arm geometry and the independent ratio V/Ω. The estimates evolve together. Meanwhile, time-lapse measurements show V changing little while Ω rises; the arms then become more tangential to the core. Measurements are reported as means with dispersion, and sample counts vary by time and measured quantity. The result is agreement between geometry and kinematics, not a universal law inferred from a photograph. [1]
4. Three ingredients: bias, alignment, supply
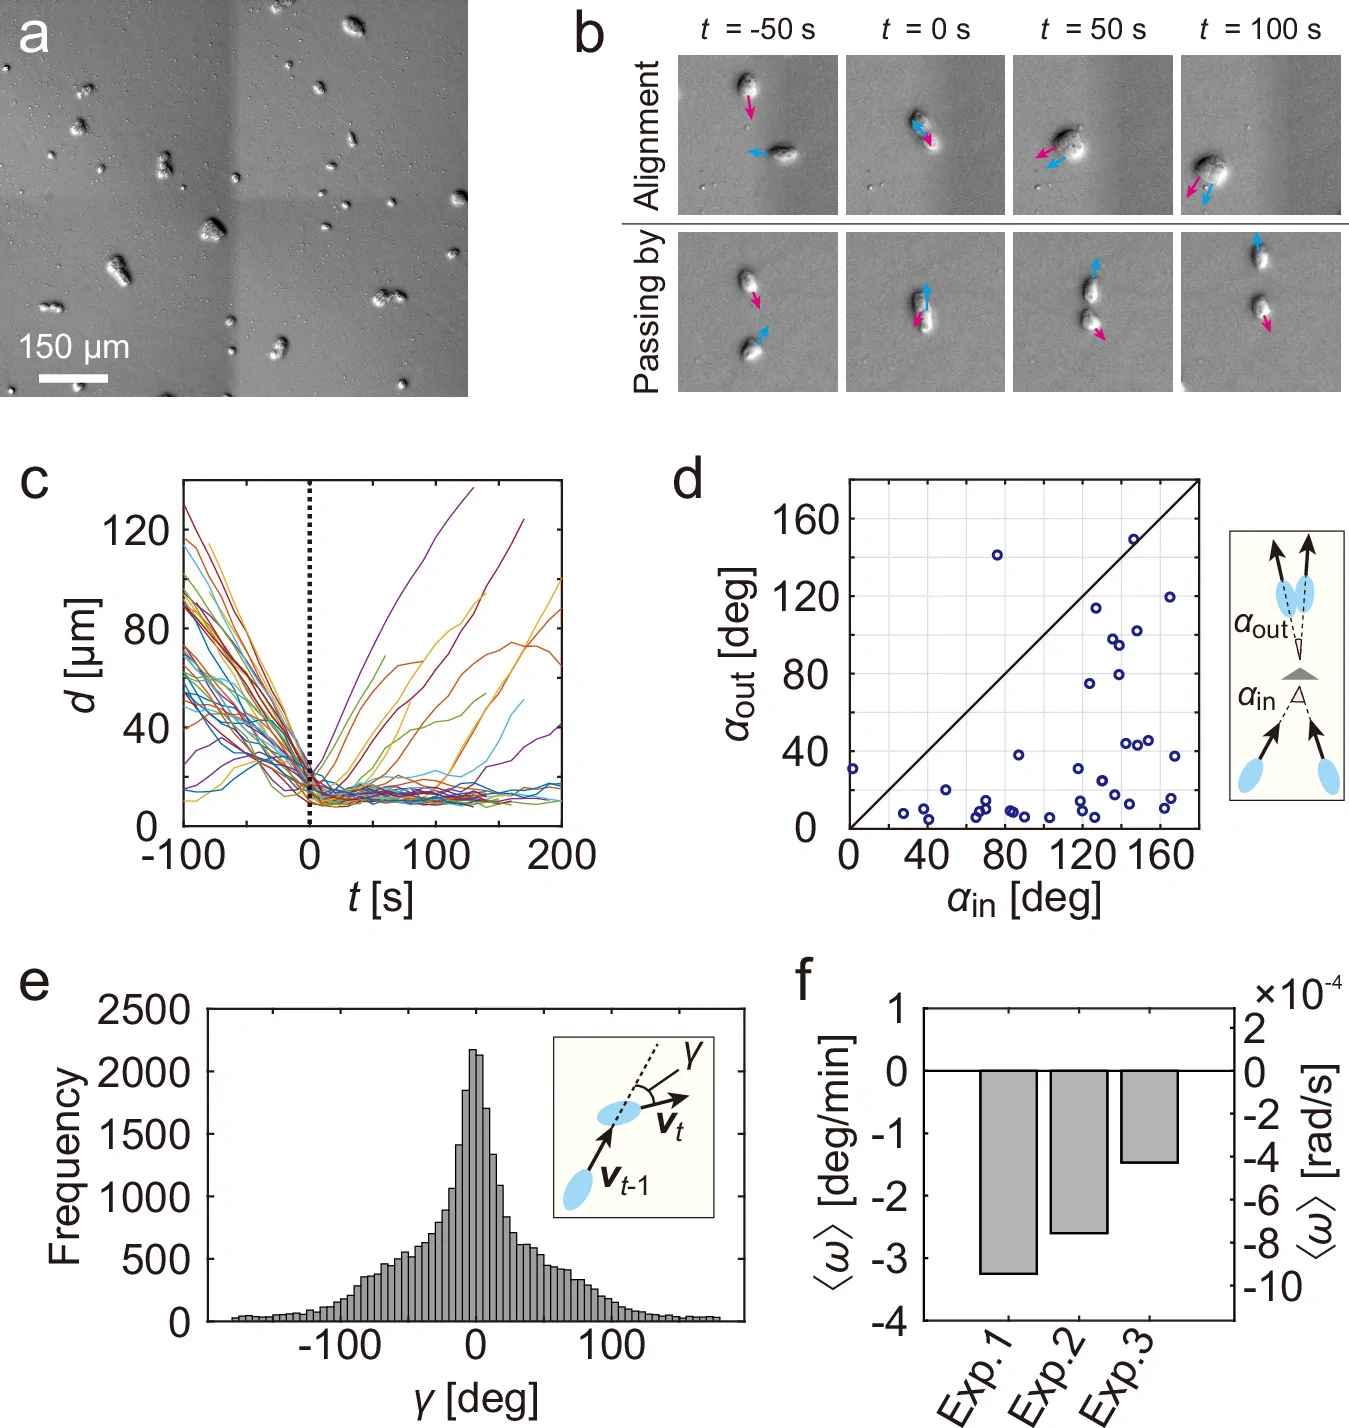
The minimal model identifies three essential ingredients: intrinsic chirality, short-range polar alignment and continuous supply from a localized source. The experiments offer separate evidence for each: a clockwise bias at cell scale, alignment after collision, and an open setup in which cell number grows. Alignment amplifies a preference too weak to impose a macroscopic pattern alone; supply sustains the moving front. This is collective amplification, not coordinated rotation around a central organism. [1]
Figure 3 connects several scales of evidence. Cell collisions often reduce the angle between migration directions; 37 collisions were tracked in two experiments. At a longer timescale, centroids of solitary cells and small clusters are tracked every 30 seconds. Trajectories turn both ways, yet mean angular velocity remains negative in all three experiments: −3.23, −2.81 and −1.60 degrees per minute, with 95% confidence intervals entirely below zero. Thousands of trajectory points do not replace independent biological repetitions; they estimate a weak signal within a small number of experiments. This distinction makes the argument stronger than drawing a clockwise arrow on a schematic. [1]
The reported mean propagation speed is V = 0.363 μm/s. The rotating front is fitted by a circle involute, with geometric scale a related to speed V and angular speed Ω. As V remains approximately stable while Ω increases, the arms become more tangential over time. This relation describes the fitted observed fronts; it does not claim that every biological spiral follows the same law. [1]
5. Reading shape as a speed measurement
The involute connects a front’s motion to the movement of its attachment point. A band is created near the edge of the rotating core, then travels outward at nearly constant speed while its origin turns at angular speed Ω. The parameter a = V/Ω therefore has units of length and sets the profile’s scale: for a given V, faster rotation changes the geometric relation between radial distance and angle. This is more informative than visual resemblance to a drawn spiral. [1]
Here r is distance from the center and θ the front’s direction; Ωt rotates the pattern in time. The fit uses points traced along real bands rather than a curve selected to look good over the micrograph. As the core contracts, Ω rises while V changes little; a decreases and the arms tilt closer to the circle’s tangent. This geometric reading allows comparisons across time and with simulations. [1]
This distinction prevents a common confusion between three curve families. An Archimedean spiral has constant radial spacing between turns; a logarithmic spiral multiplies its radius by the same factor each turn and keeps a constant angle between radius and tangent. The involute observed here instead describes a thread unwound from a circle: its law relates angle to the radial path of a front emitted by a rotating attachment point. It looks spiral-like, but its geometry encodes a specific kinematics—propagation at speed V and rotation at speed Ω. Correct classification therefore depends on measuring the curve and identifying its mechanism, not on overall appearance. [1]
6. From cell to pattern: where does amplification happen?
The weakness of the individual bias is precisely what makes the collective scale interesting. An isolated cell does not follow a stable orbit around the source. In a disordered population, small turns in both directions largely cancel. Encounters locally reduce directional differences; continuous flux replenishes the front; around the source, polar order turns a tiny mean preference into coherent circulation. This is a statistical mechanism: alignment filters noise without removing variability from individual trajectories. [1]
The authors estimate that a bias of a few degrees per minute combined with an average cell speed of about 0.52 μm/s corresponds to a rotation radius on the millimetre scale. That order of magnitude matches the observed core around the source. It links measurements at very different scales; it is not an uncertainty-free prediction of an exact radius. Core size also depends on cell supply, dimple geometry and experimental duration. [1]
The most revealing test of this causal chain comes from bands detached from the core: they propagate but do not spontaneously rotate and wind into a spiral. When researchers reduce the suspension loaded at the source, bands can still appear without acquiring the same clockwise organization. The front alone is therefore insufficient; the flux-fed core is the part that turns moving waves into a chiral pattern. [1]
The parameter φ summarizes agreement among local directions: normalize each velocity vector, average them, then take the length of that mean vector. If directions cancel, φ is near zero; if they point nearly together, it approaches one. It measures neither cell speed, the fraction of living cells nor, by itself, clockwise rotation. That is why the authors interpret it alongside vector direction and position in the pattern. The core reaches 0.94; bands remain between 0.85 and 0.90, while several gaps fall near 0.53. Order is spatially structured rather than uniform. [1]
7. The test that prevents an easy explanation
The most instructive control concerns the aggregate’s core. When core organization is suppressed, bands can still form, but they do not acquire the same organized clockwise rotation. Conversely, the observed free bands do not spontaneously turn into a spiral. Wave production, collective chirality and spiral architecture must therefore be distinguished: they are linked in the result but are not interchangeable. [1]
8. The model reveals three regimes, not an inevitable spiral
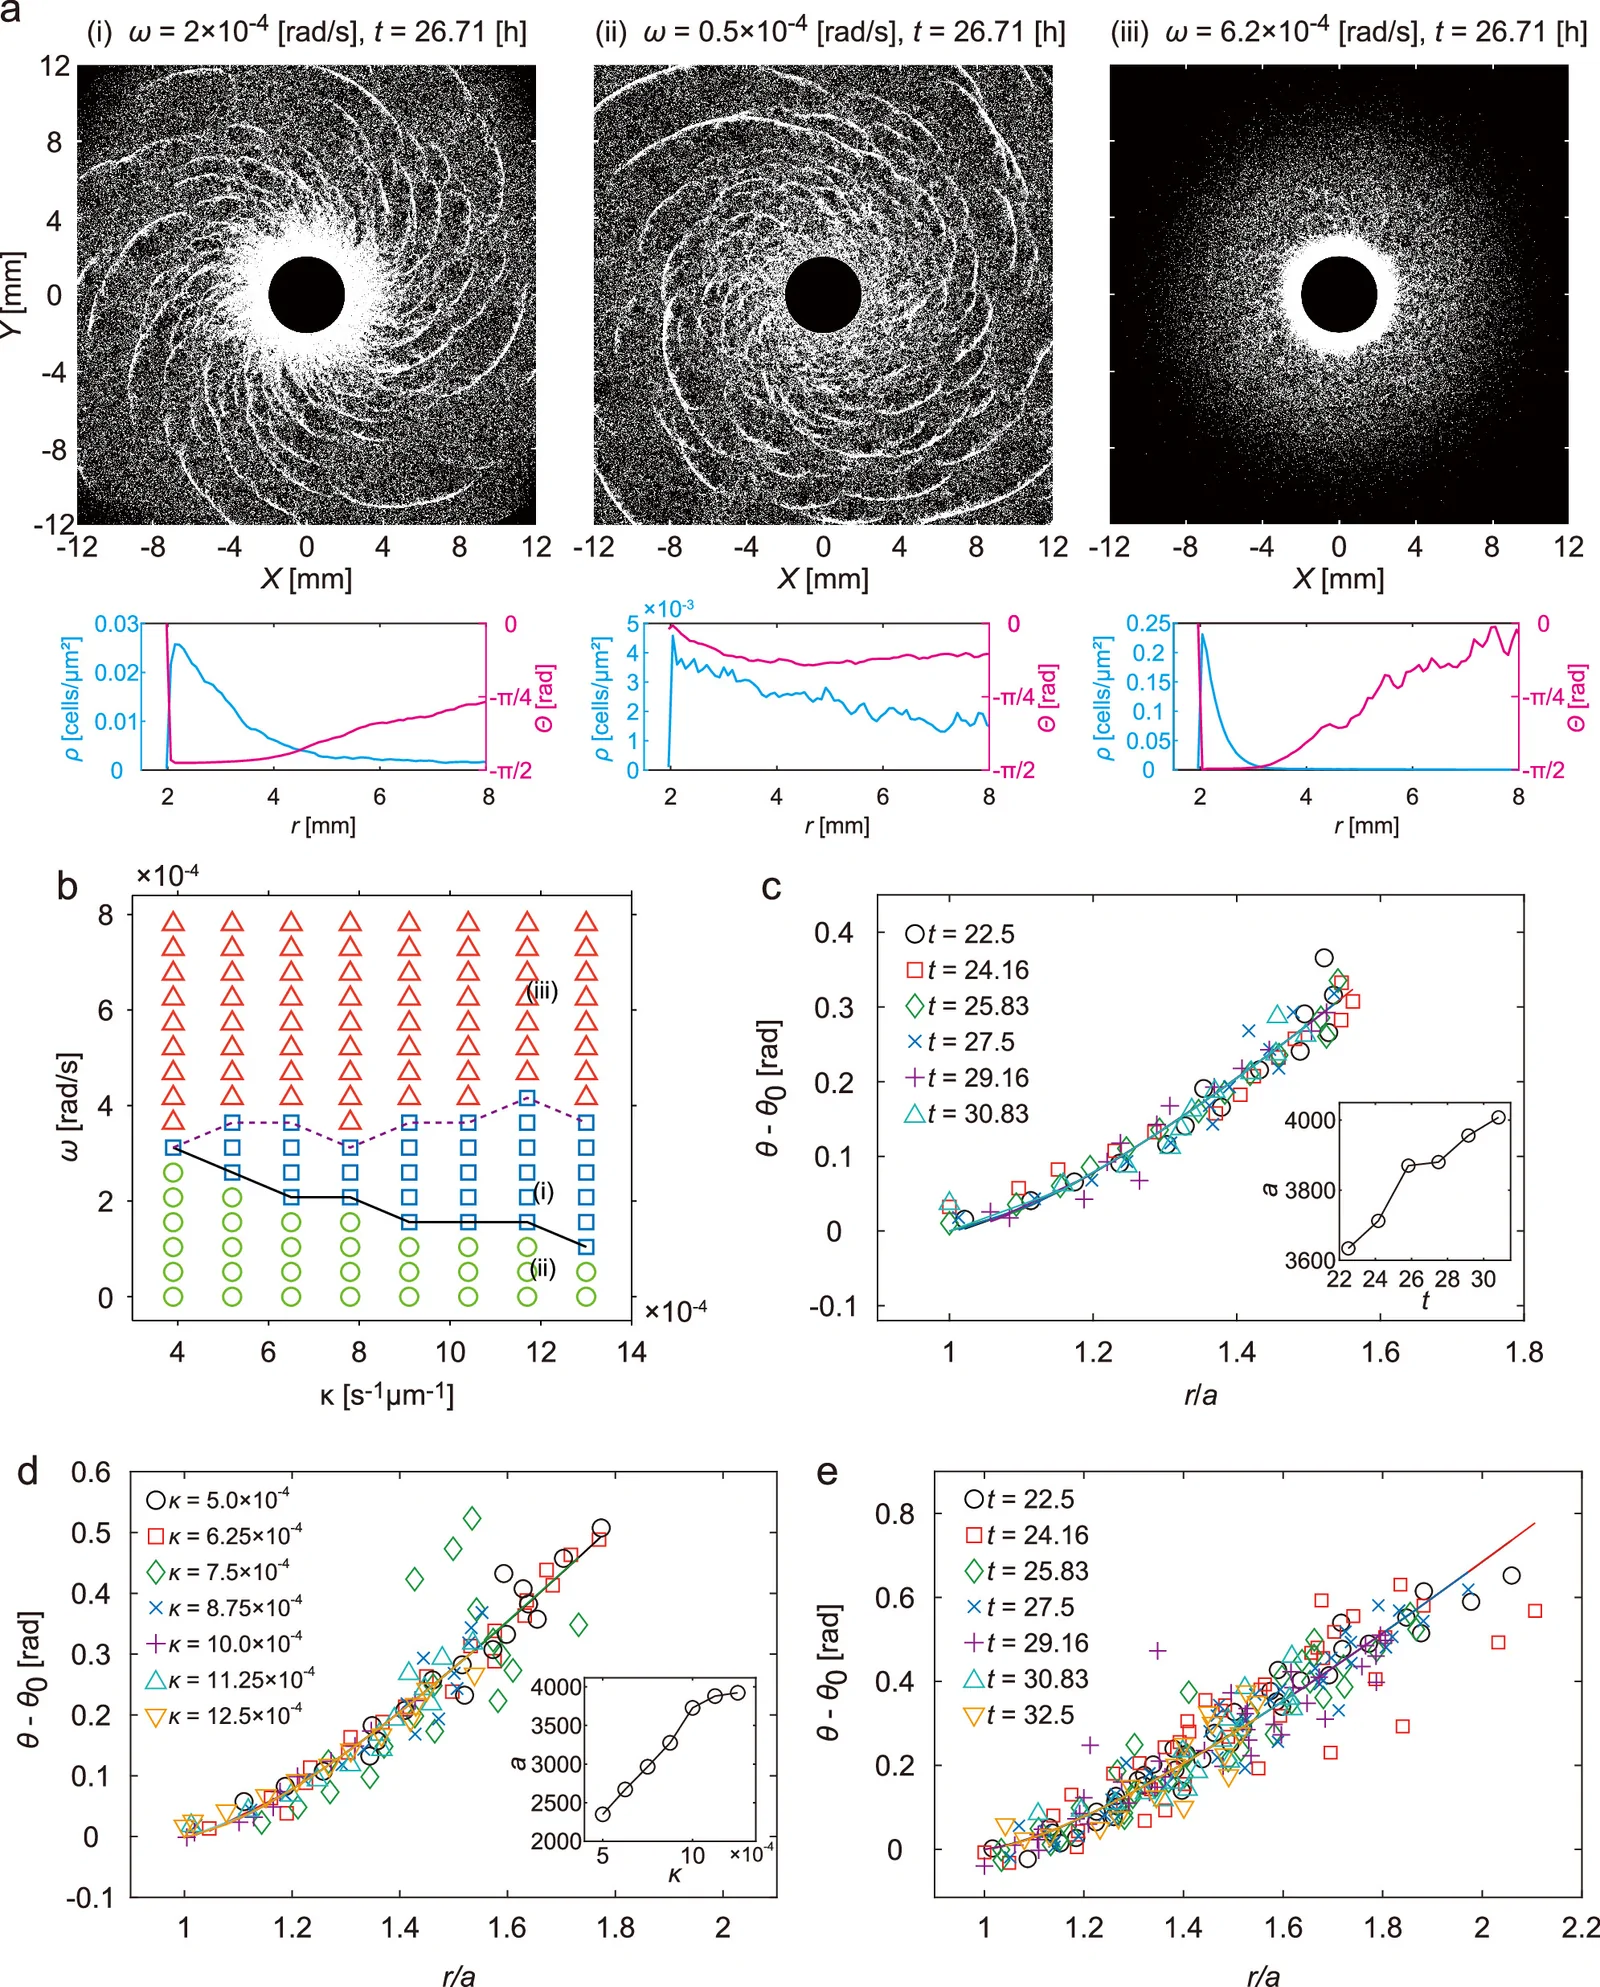
The Vicsek model is deliberately minimal: each agent keeps a fixed speed, tends to follow the mean direction of nearby agents, experiences noise and receives an intrinsic rotation. The source regularly injects new agents at its perimeter. This isolates necessary ingredients without claiming to reproduce an amoeba’s shape or all of its molecular interactions. A phase diagram then varies chiral bias and renewal rate to locate concentric, spiral and compact regimes. [1]
This notation makes the model’s choices explicit. Position advances at fixed speed v₀ along direction θᵢ; orientation changes through intrinsic bias ω, local alignment strength K and rotational noise Dᵣ. New cells are injected at the circular source boundary instead of conserving a fixed particle count. In the simulation, interactions act over roughly one cell length. This is not a molecular model; it tests whether these collective rules suffice to produce the observed regimes. [1]
To classify these regimes, the authors do not rely on visual inspection alone. They calculate a circulation parameter for rotational orientation and a spatial chiral parameter for the multi-arm structure. This matters: a dense spot can rotate without forming several arms, and a band can exist without organized rotation. Two indicators distinguish circulation, pattern chirality and density. The diagram’s “spiral region” is thus defined by observables chosen for this model. [1]
Quantitative agreement remains incomplete. Measured chirality does not exactly match the model’s spiral-forming range; the authors point in part to missing volume exclusion, which may let too many cells accumulate in the core. Changing cell supply at the source appears to explain the decrease of geometric parameter a over time, but supply could not be measured directly near the very dense region. This is an explicit model and imaging limitation. [1]
Figure 4’s phase diagram asks more than a fitting question: under what conditions does the system change regime? The authors vary chirality ω and supply rate κ, with noise set near the order–disorder transition. Weak chirality produces concentric waves; an intermediate range permits a rotating core and several arms; strong chirality leaves mainly a compact core without extended arms. The regions are classified with order parameters, using stated criteria rather than visual judgment alone. The spiral is one operating window among several possible responses. [1]
The authors compare the same pattern with three independent model families. Their qualitative agreement makes it less likely that the spiral is an artifact of one mathematical formulation. It does not make all quantitative details interchangeable: interactions are represented differently, and some parameters are chosen near the order–disorder transition. Agreement supports a class of mechanisms; it does not yet identify a unique microscopic account of every cell collision. [1]
Comparison between experiment and simulation also requires a scale choice. The authors map one simulation length unit to about 20 μm, the cell diameter, and one time step to about 19.23 s using a typical speed of 0.52 μm/s. Under this conversion, a modeled rotation of 0.004 rad per step corresponds to about 0.715 degrees per minute, on the same order as the measured bias. This is an order-of-magnitude calibration for comparing dynamics; it does not make every dimensionless parameter a directly measured biological constant. [1]
9. What the result establishes—and what it does not
The study establishes an experimental and theoretical scenario in which weak cellular chirality, local polarization and a replenished source organize large-scale rotating waves in a social unicellular organism. It makes plausible that collective chirality may contribute to developmental patterns. It does not demonstrate that this mechanism explains vertebrate left–right asymmetry or that embryonic cells follow this protocol. The bridge between organisms and scales remains to be tested. [1] [2]
The morphogenesis connection arises because some tissues are also open and supplied by localized cell sources. The authors mention neural-crest migration as a possible context. This is a research question, not an observed correspondence: chirality, alignment interactions and flux would need to be measured in real tissue and shown to causally contribute to a macroscopic asymmetry. The Dictyostelium spiral establishes a physical possibility in the laboratory, not a universal explanation of development. [1]
The historical context clarifies the advance. Earlier work on the same KI cells described nearly periodic migrating bands without clear chirality. The present result does not simply turn a wave into a pretty spiral: it adds a rotating, polar-ordered core maintained by a cell source and able to keep bands attached at its edge. Detached bands advance without noticeable rotation; when the core is weakened by reducing the amount of cells placed at the source, bands remain but lose their clockwise organization. This experimental comparison constrains the mechanism more strongly than visual analogy alone. [1]
10. Experiments that would distinguish mechanisms
A decisive test would separately measure isolated-cell bias, neighbor alignment and the flux feeding the front, then vary each factor in turn. If the bias is reversed without changing the source, core rotation should reverse; if renewal stops, arms should eventually detach or lose coherence. Simultaneously measuring flux and core radius would test the proposed link between supply, Ω and arm tilt. Repeating these tests across more samples, with distributions and uncertainties, would distinguish correlation from a robust causal chain. These are proposals, not reported results. [1]
References
- [1]Masayuki Hayakawa, Biplab Bhattacherjee, Hidekazu Kuwayama et Tatsuo Shibata. (2026). Emergence of chiral multi-armed spirals in an open system of migrating cells under continuous cell supply. Nature Communications, 17, p. 10535. DOI: 10.1038/s41467-026-78179-4. https://pmc.ncbi.nlm.nih.gov/articles/PMC13710842/ — Primary experimental and theoretical study; open access under CC BY 4.0.
- [2]RIKEN. (2026). 多細胞集団によるキラリティの増幅 — 細胞の「利き手」がつくるセンチメートル級のスパイラル. RIKEN press release. https://www.riken.jp/press/2026/20261026_1/index.html — Japanese institutional summary from the research team.